Assisted a digital marketing company to optimize KPIs and increase conversion rates with data migration and visualization tool

Enhancing Business Growth Through Data Migration and Visualization

Case Study: Enhancing Business Growth Through Data Migration and Visualization

About the Client

The client provides B2B solutions to help businesses analyze their marketing data to evaluate the performance of sales and marketing strategies and accelerate revenue & market share growth.
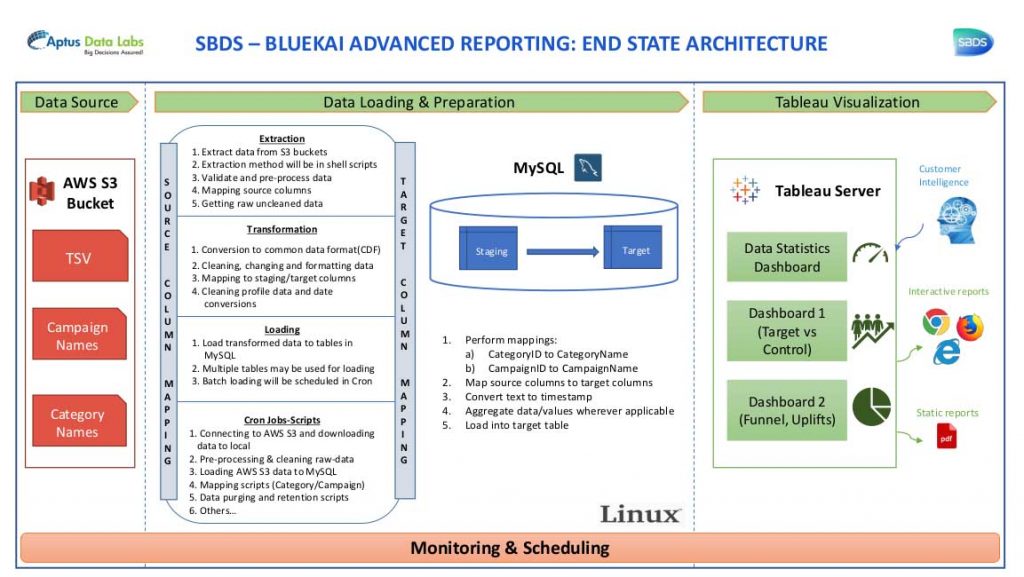
The Business Challenge

The client wanted to utilize the daily application logs in the form of raw data exports to analyze consumer behavior in digital marketing channels. Additionally, to visualize the analyzed data to increase visitor conversion rates and thus, optimize their KPIs and marketing strategy.

What Aptus Data Labs Did

Aptus Data Labs developed a solution to manipulate the customer data feed from digital marketing applications and retain the transformed data to analyze customer behavior and channel conversions. In addition, we orchestrated a continuous data ingestion & transformation pipeline that continued the structured data in a database. Moreover, we used the data to generate visualizations in the form of static reports & interactive dashboards. Hence,we solved the challenge of digitally understanding the raw data exports, structuring them, mapping them to parameter definitions, and building interpretable visualizations for the business users.

The Impact Aptus Data Labs Made

Through this project, we improved the client’s data & analytics pipeline and provided them with interpretable visualizations quantified with relevant performance metrics. Therefore, the client was able to compare the effectiveness of digital marketing campaigns in several media, hence improving their targeted marketing strategy, and subsequently contributed to growth in their business performance.

The Business and Technology Approach

Aptus Data Labs used the following approach to plan, develop, and execute the workflow and solve existing challenges. 

  1. Schedule daily scripts to:

2. Analyze business requirements to develop relevant metadata statistics, KPIs, and Funnel Analysis visualizations in Tableau.

3. Build and deploy target database and dashboards, to be accessed by client-side users regularly, on the AWS platform.

Workflow/Architecture

Tools Used

ETL

Python, SQL query

Database

MySQL (Amazon RDS)

Business Intelligence

Tableau

Orchestration & Scheduling

Shell Scripts, Cron Jobs

File Retention & Deployment

AWS S3, AWS EC2

The Outcome

The log data ingestion pipeline & analytics dashboards enabled the client to understand the performance of their digital marketing campaigns and thus improve their targeted marketing strategies.

Related Case Studies

Case Study: Achieving Low-Latency API-Based Queries with MongoDB

Achieving low-latency API-based queries with Mongo DB

Performance analysis - MapR DB vs. Mongo DB - Tool Selection Process
Case Study: Revolutionizing Pharma Analytics with AWS Data Lake

Revolutionizing Pharma Analytics with AWS Data Lake

Enterprise Data Lake and Analytics implementation for a large Pharmaceutical Company in India on AWS platform
Case Study: Boosting Performance with Apache Spark Migration

Boosting Performance with Apache Spark Migration

Data Migration & Performance Improvement of large data processing

Unlock the Potential of Data Science with Aptus Data Labs

Don't wait to harness the power of data science - contact Aptus Data Labs today and start seeing results.

Get In touch with our  Experts

If you’re looking to take your business to the next level with data science, we invite you to contact us today to schedule a consultation. Our team will work with you to assess your current data landscape and develop a customized solution that will help you gain valuable insights and drive growth.